


About Us
Executive Editor:Publishing house "Academy of Natural History"
Editorial Board:
Asgarov S. (Azerbaijan), Alakbarov M. (Azerbaijan), Aliev Z. (Azerbaijan), Babayev N. (Uzbekistan), Chiladze G. (Georgia), Datskovsky I. (Israel), Garbuz I. (Moldova), Gleizer S. (Germany), Ershina A. (Kazakhstan), Kobzev D. (Switzerland), Kohl O. (Germany), Ktshanyan M. (Armenia), Lande D. (Ukraine), Ledvanov M. (Russia), Makats V. (Ukraine), Miletic L. (Serbia), Moskovkin V. (Ukraine), Murzagaliyeva A. (Kazakhstan), Novikov A. (Ukraine), Rahimov R. (Uzbekistan), Romanchuk A. (Ukraine), Shamshiev B. (Kyrgyzstan), Usheva M. (Bulgaria), Vasileva M. (Bulgar).


Materials of the conference "EDUCATION AND SCIENCE WITHOUT BORDERS"
 PDF
PDFThe mathematical model of the ethanolamines synthesis unit is consisted of the two units: the mathematical model of the mixer reactor and the mathematical model of the displacement reactor, having related between them by the material flows in the technological scheme.
The bloc – diagram of the synthesis unit mathematical model has been constructed, as for the cascade of the two reactors: the mixing, as well as the displacement, having installed in series and having worked in the continuous operation regime (see, Fig. 1).
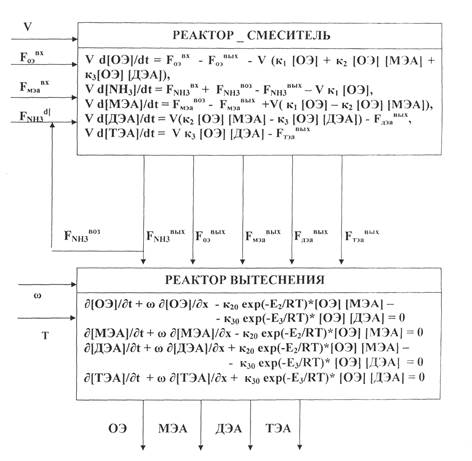
Figure 1 – The Bloc – Diagram of the Ethanolamines Synthesis Unit Mathematical Model
a) mixer – reactor; b) displacement reactor; c) ОЭ – OE – ethylene oxide; d) МЭА – MEA – mono-ethanolamine; e) ДЭА – DEA – di-ethanolamine; f) ТЭА – TEA – tri-ethanolamine.
The input components flows are the input variables of the model: the ethylene oxide (EO), the mono-ethanolamine (MEA), the ammonia NH3 and NH3 return, the output parameters – this is the reaction mixture composition at the synthesis unit output: the mono-ethanolamine (MEA), di-ethanolamine (DEA), tri-ethanolamine (TEA), and the ethanolamine’s (EA) tracks or their absence.
This process is conducted at the ammonia’s multiple excess, which is circulated in the synthesis unit, and the control for the return ammonia flow will be allowed to be efficiently used the supply of the fresh ammonia flow.
On the basis of the above-stated, it is quite possible to be supposed the following diagram of the ethanolamines synthesis unit optimal control (see, Fig. 2).
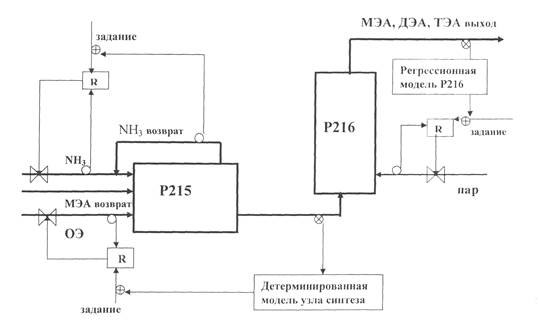
Figure 2 – The Ethanolamines Production Optimal Control Diagram at the Synthesis Stage
a) job; b) NH3 return; c) MEA return; d) EO; e) R – Return; f) MEA, DEA, TEA output; g) P-216 Regression model; h) steam; i) Synthesis unit deterministic model.
The mono-ethanolamine flow supply in the mixer – reactor has already been stabilized, the ammonia flow supply is adjusted from the supply stock, on the basis of the results of the output flow analytical control from the mixture, by means of the mixer – reactor mathematical model to be achieved the reaction mixture optimal composition at the unit’s outlet. One of the components is the optimality criterion at the reactor’s down-flow, and mostly mono-ethanolamine:
I = [MEA] → max. (1)
To be solved the set challenge, on the basis of the object mathematical model (e.g. the systems of the ordinary differentiation equations), the optimum search is carried out, by the numerical integration of the equations system with the variation of the control input parameter Feoin (e.g. by the ethylene oxide supply) one of the one – parameter optimization techniques, and then, with the subsequent adjusting of the regulator job’s ethylene oxide control flow.
Thus, the optimal composition of the reaction mixture at the outlet of the synthesis unit is practically achieved by the temperature adjusting in the P216 reactor, due to the steam supply, having determined by the P216 reactor regression model.
Sazhin S.G., Penkin K.V. THE ETHANOLAMINES SYNTHESIS UNIT MATHEMATICAL MODEL AND
THE PRODUCTION OPTIMAL CONTROL BASIC DIAGRAM AT THE SYNTHESIS STAGE . International Journal Of Applied And Fundamental Research. – 2013. – № 2 –
URL: www.science-sd.com/455-24343 (18.04.2024).