


About Us
Executive Editor:Publishing house "Academy of Natural History"
Editorial Board:
Asgarov S. (Azerbaijan), Alakbarov M. (Azerbaijan), Aliev Z. (Azerbaijan), Babayev N. (Uzbekistan), Chiladze G. (Georgia), Datskovsky I. (Israel), Garbuz I. (Moldova), Gleizer S. (Germany), Ershina A. (Kazakhstan), Kobzev D. (Switzerland), Kohl O. (Germany), Ktshanyan M. (Armenia), Lande D. (Ukraine), Ledvanov M. (Russia), Makats V. (Ukraine), Miletic L. (Serbia), Moskovkin V. (Ukraine), Murzagaliyeva A. (Kazakhstan), Novikov A. (Ukraine), Rahimov R. (Uzbekistan), Romanchuk A. (Ukraine), Shamshiev B. (Kyrgyzstan), Usheva M. (Bulgaria), Vasileva M. (Bulgar).


Engineering
 PDF
PDFThe principle of gas analyzer is based on a method for detecting the amount and presence of gaseous substances in the atmosphere of the controlled zone, that emit and absorbing radiation in the infrared spectral range.
A block diagram of the developed measuring complex on the basis of measurement of background infrared radiation is presented. This device allows monitoring and detection of a wide variety of gaseous substances over large areas. To do this, at least three reflectors on the turret scanners are installed at the perimeter of the controlled area. Scanner reflectors triangulation data allows to determine the area of the gassy zone, the point of gas leakage on the maximum absorption (emission) and perimeter of the gassy zone, with the superimposition of the boundaries of the gassy zone and the point of leakage onto the mnemonic diagram of the process equipment on the monitor screen.
Key words: remote gas analyzer, monitoring, industrial zone, atmosphere, turret scanner, gaseous substances, triangulation, zone, mnemonic diagram, monitor screen.
Annually as a result of an active industrial human activity, hundreds of thousands of different pollutants are emitted into the atmosphere. The most important polluting gas components are carbon oxides, hydrocarbons, which participate in the formation of photochemical smog. In this regard, for the prevention of environmental disasters in the production area of oil refineries, sudden emissions and levels of pollutants in the atmosphere are monitored.
The methods of air samples chemical analysis require considerable time and sometimes they are difficult to implement, if it is necessary to ensure continuous real time monitoring of the possible sudden appearance of toxic substances in the air.
Nowadays, gaseous pollutants in the atmosphere are effectively detected by spectral analysis methods. In remote sensing the "windows of transparency" have the greatest interest 0,75-1,1; 1.6-1,8; 2,1-2,3 μm. In this range the earth's own radiation can be ignored [2].
There are two windows with relatively high transparency of the atmosphere 3-5 and 8-13 μm in the infrared range, which are widely used for remote sensing of the earth's surface.
Industrial zone atmosphere gas analyzer [1] can monitor both directly in the contaminated zone and at a considerable distance from the controlled area.
The principle of gas analyzer is based on a method for detecting the amount and presence of gaseous substances in the atmosphere of the controlled zone, that emit and absorbing radiation in the infrared spectral range.
Background radiation is emitted by any object whose temperature is above absolute zero. Therefore, the spectrum can be obtained in almost any environment.
Thus, it is possible to determine the relative concentration of a particular substance in the controlled area from the emitting or absorbing spectrum inherent in the substance. Determination accuracy depends on such factors as the temperature difference between background objects and specific gaseous substances, the distance between the monitored zone and the gas analyzer, the weather, etc. A simplified block diagram of the developed measuring complex based on the use of background infrared radiation is shown in Fig.1.
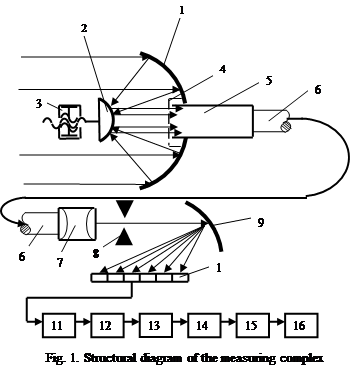
The background infrared radiation is collected by the reflector 1, the accumulated infrared radiation from the reflector 1 is reflected on the curved reflector 2. The infrared radiation collected by the reflector 2 is passed through a safety window 4 that transmits IR radiation and is collimated by a collimator 5. From the collimator, infrared radiation enters the fiber optic waveguide 6, whereby all the spectrometer units (optics and electronic components) are located indoors and are not exposed to the atmosphere [1].
The IR reflector with a collimator is mounted on the turret of the scanner, which allows scanning the field of view from 0 to 360о with a resolving power of 1о. The infrared radiation passes through the optical fiber to the optical condenser 7, which focuses and enters the polychromator 8, which forms an IR spectrum in the range of 3-5 μm bands (transmission above 90%) and 8-14 μm (transmission 60-70%) [3]. This range includes at least one characteristic that determines the frequency band for almost all gaseous pollutants, while at the same time most of the energy of radiation emitted by objects at earth temperatures falls on this range [2]. From the output of the polychromator, the IR beam from the dispersing element 9 is split into a spectrum that is controlled by a photodiode array 10.
The signals of the interferogram from the photodiode array are transmitted to the preamplifier unit 11, from which they are received via the switch 12 to the A/D converter 13, the spectrum converted into a digital code is fed to the digital filter 14, which is part of the program of the computer 15.
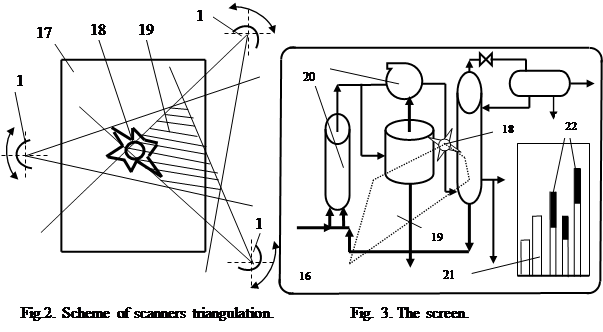
Through Fast Fourier Transform spectral processing algorithms, data is outputted as a chart (in graphic form 21,22) on the monitor 16, which shows the mnemonic diagram of the industrial area controlled part. (Figure 3).
By moving the small reflector 2 with a screw pair 3 along the optical axis, we can change the field of view of the controlled zone, that allows to provide a wide viewing sector. It is also possible to focus the reflector in such a way that a closer viewing sector is provided to determine the source of the gas leak. Triangulation method is used, to accurately determine the coordinates of the gas leakage point. For this, at least three reflectors on turret scanners 1 are installed on the perimeter of the monitored zone (Figure 2). Scanner reflectors triangulation data 1 allows to determine the area of the gassy zone, the point of gas leakage on the maximum absorption (emission) and perimeter of the gassy zone 19, with the superimposition of the boundaries of the gassy zone and the point of leakage 18 onto the mnemonic diagram of the process equipment 20 on the monitor screen 16 (Figure 3).
This device allows monitoring and detection of a wide variety of gaseous substances over large areas.
Before conducting multispectral measurements by means of the gas analyzer, that can determine the presence of a particular contaminant in the atmosphere, the gas analyzer should be calibrated.
2. J. Lloyd. Thermal imaging systems. (Translation from English). M: The World, 1978. P. 414.
3. Levitin I.B. Infrared technology. Energy. L. Branch, 1973. P. 113
Astapov V.N., Zhitkov V.A. INDUSTRIAL ZONE ATMOSPHERE MONITORING. International Journal Of Applied And Fundamental Research. – 2017. – № 3 –
URL: www.science-sd.com/471-25306 (16.05.2026).