


About Us
Executive Editor:Publishing house "Academy of Natural History"
Editorial Board:
Asgarov S. (Azerbaijan), Alakbarov M. (Azerbaijan), Aliev Z. (Azerbaijan), Babayev N. (Uzbekistan), Chiladze G. (Georgia), Datskovsky I. (Israel), Garbuz I. (Moldova), Gleizer S. (Germany), Ershina A. (Kazakhstan), Kobzev D. (Switzerland), Kohl O. (Germany), Ktshanyan M. (Armenia), Lande D. (Ukraine), Ledvanov M. (Russia), Makats V. (Ukraine), Miletic L. (Serbia), Moskovkin V. (Ukraine), Murzagaliyeva A. (Kazakhstan), Novikov A. (Ukraine), Rahimov R. (Uzbekistan), Romanchuk A. (Ukraine), Shamshiev B. (Kyrgyzstan), Usheva M. (Bulgaria), Vasileva M. (Bulgar).


Engineering
 PDF
PDFI. Simulation of hereditary effects
The informational method of simulation of hereditary effects is grounded on introducing of a line-up of factors interacting sequentially against each other in the form of an information channel in which the information on the first factor arrives and sequentially will be transformed to the information on a total indication.
Let's consider a case when initially unique factor X sequentially will be transformed to Y (graf. 1).
Here H(X1),H(X2), … H(Xn) – an information quantity concluded in factor Х after first, second, … last operation; H (Y) – an information quantity concluded in indication Y; I(XkÞY/X1,X2,…,Xk-1) – an information quantity, transmitted to Y after working off k factors.
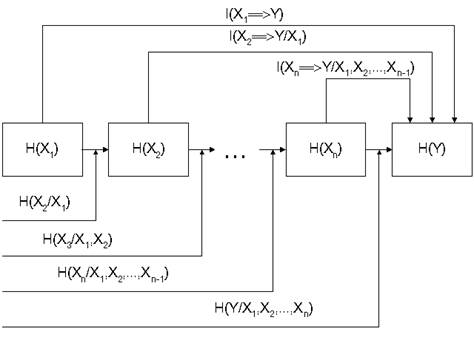
Graf. 1. The Information channel
![]() The
consecutive increment of the information is equal:
The
consecutive increment of the information is equal:
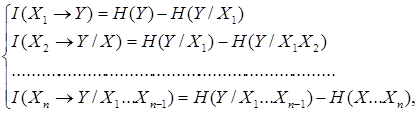 (1)
(1)
![]() Here H(Y) - an
information quantity (entropy) about Y; H(Y/X1X2…) - the information quantity
(entropy) received as a result of action on Y of various not considered
factors. Since
Here H(Y) - an
information quantity (entropy) about Y; H(Y/X1X2…) - the information quantity
(entropy) received as a result of action on Y of various not considered
factors. Since![]() , then
, then
 (2)
(2)
The level of influence of factor X on an indication Y at informational simulation can be evaluated by means of coefficient of informational connection q:
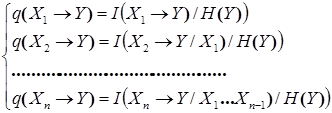 (3)
(3)
The coefficient of informational correlation is equal to unit if the information on an indication is completely defined by the information on factors; it is equal to zero if the indication does not depend on factors; generally the coefficient of informational correlation is concluded between zero and unit.
II. Simulation of simultaneous processes
Let the correlation between three factors-indications X, Y, Z is defined. On the basis of the chart of John Venn (graf. 2) is received:
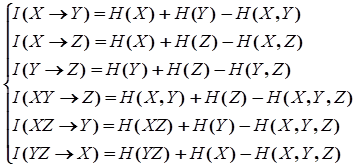 (4)
(4)
For the quantitative estimation of associations between parametres it is necessary to calculate coefficients of informational connection
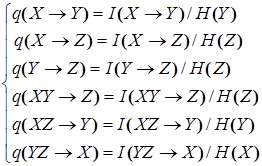 (5)
(5)
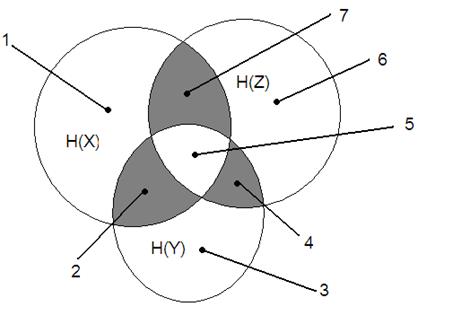
Graf. 2. The chart of informational connection
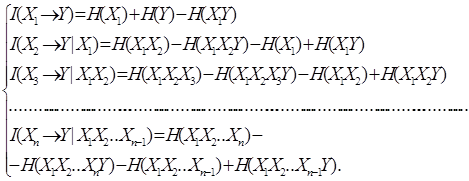
Generalising the received outcomes on n parametres, association in between we will express the following formula:
![]() . (6)
. (6)
III. The Analysis of models
At creation of models all theoretical values of entropies in the formulas reduced above are substituted by their estimations:
![]() (7)
(7)
where![]() -
empirical probability of hit of an aleatory variable X in a state number i; fi
- empirical frequency of hit of values X in this state; n - number of experiences.
-
empirical probability of hit of an aleatory variable X in a state number i; fi
- empirical frequency of hit of values X in this state; n - number of experiences.
It is displayed that the estimation of the information I (XY) ®to within a constant factor has c2 allocation (see [2]):
![]() (8)
(8)
Here ![]() -
number of degree of freedoms;
-
number of degree of freedoms; ![]() an
amount of intervals of a partition of input and output parametres accordingly.
an
amount of intervals of a partition of input and output parametres accordingly.
The information transmitted from one parametre to another, is considered significant, if
![]() (9)
(9)
Where ![]() - α - a quantile
c2 -
allocations; α – a confidence level.
- α - a quantile
c2 -
allocations; α – a confidence level.
Allocation of the Pearson at m> 25 can be substituted Gaussian distribution with a variance s2=2m that gives the chance to define a confidence interval for the information:
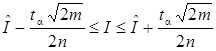 (10)
(10)
Value tα - α-kvantil of a normal distribution. A confidence interval for coefficient of informational connection q is:
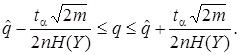 (11)
(11)
The minimum sample size is determined by means of necessary precision of ΔI value:
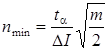 (12)
(12)
In case of linear model the coefficient of correlation and coefficient of informational connection have a close connection among themselves, defined by statistical equality q=r2 [1].
IV. The Example of application of an informational model
It is necessary to research association of labour productivity (Y) from a salary (X) (in percentage of basic value) (tab. 1).
The first step – creation of the chart of dispersion (graf. 3.).
Than we build the two-dimensional histogram. It is for this purpose defined the main statistical performances of researched aleatory variables (tab. 2) and we divide ranges of factors Х and Y into the intervals which breadth is close to an average quadratic deviation.
Table 1
Input datas for model creation
|
№ |
Х |
Y |
№ |
X |
Y |
№ |
X |
Y |
№ |
X |
Y |
№ |
X |
Y |
|
1 |
134 |
109 |
21 |
147 |
112 |
41 |
102 |
69 |
61 |
146 |
113 |
81 |
127 |
116 |
|
2 |
136 |
116 |
22 |
180 |
140 |
42 |
132 |
108 |
62 |
154 |
102 |
82 |
101 |
75 |
|
3 |
148 |
102 |
23 |
125 |
108 |
43 |
131 |
97 |
63 |
176 |
138 |
83 |
153 |
122 |
|
4 |
127 |
98 |
24 |
113 |
80 |
44 |
122 |
98 |
64 |
128 |
106 |
84 |
111 |
89 |
|
5 |
133 |
87 |
25 |
124 |
84 |
45 |
139 |
99 |
65 |
116 |
81 |
85 |
152 |
107 |
|
6 |
121 |
95 |
26 |
116 |
84 |
46 |
147 |
117 |
66 |
110 |
83 |
86 |
154 |
107 |
|
7 |
155 |
106 |
27 |
147 |
113 |
47 |
121 |
92 |
67 |
124 |
96 |
87 |
129 |
101 |
|
8 |
104 |
69 |
28 |
159 |
107 |
48 |
122 |
97 |
68 |
103 |
85 |
88 |
156 |
115 |
|
9 |
146 |
106 |
29 |
110 |
83 |
49 |
136 |
108 |
69 |
166 |
119 |
89 |
143 |
114 |
|
10 |
158 |
115 |
30 |
101 |
72 |
50 |
136 |
100 |
70 |
173 |
137 |
90 |
120 |
88 |
|
11 |
154 |
116 |
31 |
132 |
109 |
51 |
133 |
84 |
71 |
124 |
86 |
91 |
117 |
89 |
|
12 |
166 |
131 |
32 |
107 |
85 |
52 |
105 |
76 |
72 |
122 |
92 |
92 |
128 |
98 |
|
13 |
101 |
73 |
33 |
106 |
92 |
53 |
135 |
103 |
73 |
118 |
99 |
93 |
139 |
105 |
|
14 |
129 |
94 |
34 |
152 |
117 |
54 |
133 |
104 |
74 |
159 |
128 |
94 |
148 |
110 |
|
15 |
102 |
86 |
35 |
124 |
100 |
55 |
111 |
85 |
75 |
161 |
119 |
95 |
146 |
104 |
|
16 |
119 |
94 |
36 |
120 |
82 |
56 |
116 |
90 |
76 |
172 |
144 |
96 |
156 |
113 |
|
17 |
156 |
114 |
37 |
126 |
90 |
57 |
140 |
109 |
77 |
139 |
105 |
97 |
101 |
76 |
|
18 |
150 |
121 |
38 |
127 |
106 |
58 |
159 |
139 |
78 |
125 |
94 |
98 |
129 |
95 |
|
19 |
177 |
145 |
39 |
150 |
130 |
59 |
162 |
143 |
79 |
114 |
101 |
99 |
102 |
86 |
|
20 |
147 |
111 |
40 |
114 |
94 |
60 |
115 |
90 |
80 |
120 |
95 |
100 |
119 |
94 |
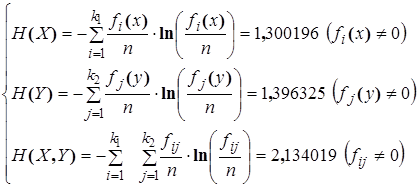
The third step is an evaluation of entropies H (X), H (Y), H (X, Y).
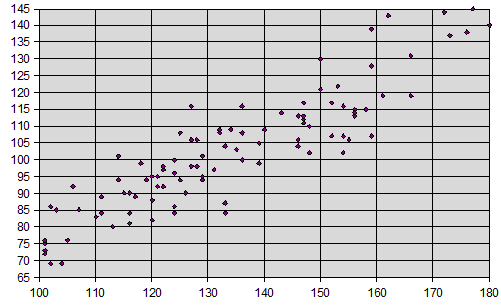
Graf. 3. A field of dispersion of the experimental observations of association of labour productivity (Y) from a salary (X) (in percentage of basic value).
Table 2
The main statistical performances
|
|
Х |
Y |
|
Average |
133,21 |
102,1 |
|
Standard deviation |
20,27154 |
17,34062 |
|
Sampling variance |
410,9353 |
300,697 |
|
Minimum |
101 |
69 |
|
Maxima |
180 |
145 |
In tab. 3 frequencies of hit of values of a two-dimensional aleatory variable in appropriate intervals are reduced.
Table 3
Two-dimensional bar graph
|
Y |
X |
f (y) |
|||
|
100-120 |
120-140 |
140-160 |
160-180 |
||
|
69-86 |
17 |
4 |
|
|
21 |
|
86-103 |
13 |
17 |
3 |
|
33 |
|
103-120 |
|
12 |
20 |
2 |
34 |
|
120-137 |
|
|
5 |
2 |
7 |
|
137-145 |
|
|
|
5 |
5 |
|
f (x) |
30 |
33 |
28 |
9 |
|
The mutual information is equal I(X®Y)=H(X)+H(Y)-H(X,Y)=0,562502 , and coefficient of informational connection q(X®Y)= I(X®Y)/H(Y)=0,402844.
The fourth step. An estimation of significance of the
discovered connection by criterion of the Pearson (8). In our case k1=4, k2=5. Calculated value of Pearson
criterion of the Pearson is equal to ![]() . Table value
at number of degree of freedoms m
= (4-1 (5-1) =12 ×and a fiducial probability a=0,95 is
equal to
. Table value
at number of degree of freedoms m
= (4-1 (5-1) =12 ×and a fiducial probability a=0,95 is
equal to![]() . Since a
calculated value of Pearson criterion more than table connection between Y and
Х it is
significant.
. Since a
calculated value of Pearson criterion more than table connection between Y and
Х it is
significant.
Thus, in paper the technique of simulation which is based on methods of the information theory is offered and justified. The example of creation of an informational model is reduced.
2. Eye, A. von. On the Equivalence of the Information-Theoretic Transmission Measure to the Common 2-Statistic. – “Biom. J.”, v. 22, 1925, p.p. 700-725.
3. Kullback S. Information Theory and Statistics. New York – John Willey & Songs, Inc. – 1965.
4. Yudin S.V., Yudin A.S. Informational-Statistics Methods of solution econometrical, sociological and psychometric problems. – Tula: Publishing house of the Tula state university, 2010. – 124 p.p.
5. Yudin S.V., Grigorovich V. G, Yudin A.S. Information-statistical methods of an estimation of quality of a flow of repousses in the conditions of acceptance testing//Blacksmith's forming production. Handling of metals by pressure.
6. Yudin S. The Informational Criterion of Identification of the Distribution // Modern European Researches. - 2015. - № 4. - С. 133-137
Yudin S.V. ENTROPY AND ECONOMETRICS. SIMULATION. International Journal Of Applied And Fundamental Research. – 2016. – № 3 –
URL: www.science-sd.com/465-25012 (22.07.2026).