


About Us
Executive Editor:Publishing house "Academy of Natural History"
Editorial Board:
Asgarov S. (Azerbaijan), Alakbarov M. (Azerbaijan), Aliev Z. (Azerbaijan), Babayev N. (Uzbekistan), Chiladze G. (Georgia), Datskovsky I. (Israel), Garbuz I. (Moldova), Gleizer S. (Germany), Ershina A. (Kazakhstan), Kobzev D. (Switzerland), Kohl O. (Germany), Ktshanyan M. (Armenia), Lande D. (Ukraine), Ledvanov M. (Russia), Makats V. (Ukraine), Miletic L. (Serbia), Moskovkin V. (Ukraine), Murzagaliyeva A. (Kazakhstan), Novikov A. (Ukraine), Rahimov R. (Uzbekistan), Romanchuk A. (Ukraine), Shamshiev B. (Kyrgyzstan), Usheva M. (Bulgaria), Vasileva M. (Bulgar).


Biological sciences
 PDF
PDFObjective and adequate diagnostic results (including on the basis of subjective information) are the basis of theoretical and practical medicine . The condition of the body as a whole and of individual physiological systems and organs are characterized by a defined register with the help of special devices and methods and visual observation of the static and dynamic values of certain biomedical signals.
Currently, the implementation of diagnostic procedures of different orientation and complexity there is a long list of methods, algorithmic and hardware tools to implement them on the basis of modern computing technology and the universal or specialized computer tools.
In technical areas currently are widely used achievements of artificial intelligence, which are increasingly used in biological and medical research (both in theory and in practice).
The basis of artificial intelligence is a systematic analysis of self-organization and modeling, which are the most adequate strategic processes of functioning of the organism (and its components) in norm and pathology. One such process is ensuring the necessary level of metabolism, which plays a big role in blood.
Blood is a connective tissue with a vehicle function. This unique ability makes extensive use of the characteristics of circulatory and blood parameters in the diagnostic process [1, 5 , 8].
Ultimately, the functioning of the body (primarily, various kinds of metabolism) and its individual components (organs, physiological, and functional systems) [9] energy and information is determined by the cardiovascular system, respiratory system and other constituents, providing timely and needed composition and transport of blood.
Currently, the most versatile and simply realizable method of analysis of transport, and connective properties of the blood is the study of plethysmogram (photo and pneumo plethysmograph, rheogram of different vessels). While great attention is paid to the quality registration because due to objective reasons, there is a large amount of interference and artifacts, and the installation and operation of the sensors requires a highly individual approach and consideration of the external conditions of registration.
In the classical analysis of the photoplethysmogram (PPG) using computational tools most widely practiced the Fourier spectral analysis of the signal was within a few tens of cycles (20-30 seconds). An example of photoplethysmograms and its Fourier spectra recorded from the same healthy men in the age of 24 before and after exercise with the phalanges of the thumb, shown in figure 1, respectively. (The exercise used exercise on a stationary bike for 3 minutes at average load).
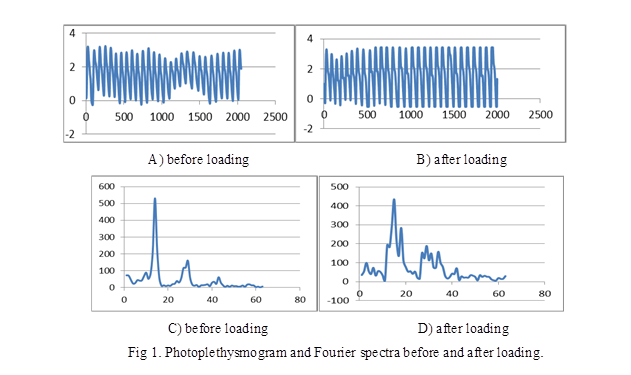
The figure clearly observed amplitude differences in the areas of low and medium frequencies. Consequently, the cardiovascular system can be explored through the analysis of the phase-frequency and amplitude-frequency characteristics of the spectrum of PPG.
However, it can be assumed that the characteristics of the vessel and the metabolic process characterizes the form of one cycle of plethysmogram for this observable is shown in figure 2 a,b (signal and spectrum).
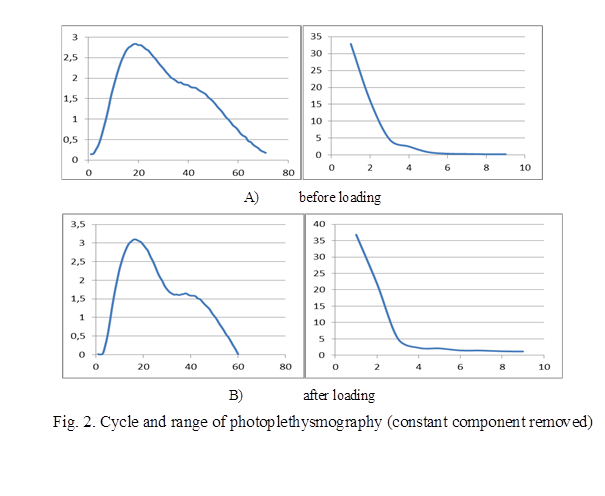
From the presented graphs it is clearly seen that, despite the change in shape of the PPG, the spectral function is almost not changed. Thus, we can assume that the spectral Fourier analysis of one cycle of the PPG is not sensitive enough and informative for diagnostic purposes the changes of the human condition during loading. However, it is possible to assume the specificity of the characteristics of the spectrum for a particular person (kind of a current "snapshot" with stable, unchanging sufficiently long period characteristics).
Cycle analysis of PPG objectively shows that after the load on the bike there is a "compression" of the schedule by approximately 15% on the background of growth of the amplitude of 5-7% and a decrease in the area of 3.5%. This is diagnose the corresponding increase of the pulse and the difference between the upper and lower limits of blood pressure (systole and diastole) and a good adaptive capabilities of the organism.
Meanwhile, the frequency analysis of the Fourier cycle of the photoplethysmography, in our opinion has two «negative» features:
• the need to increase the sampling rate of the recorded signal to provide the required size of the "window" spectral analysis;
• "noise" effect of the characteristics is clearly not informative frequencies because the behavior of the functions of photoplethysmography in time suggests the presence of only a few peismaker involved in the formation cycle.
In NDT and pattern recognition studies of technical systems together with the direct Fourier transform with acceptable diagnostic efficacy of frequently used information (enclosed with broadband signals) obtained as a result of multiple direct and inverse Fourier transforms, the bispectral analysis of the autocorrelations of the third or more orders of magnitude [3]. Research in these areas in medical practice are both relevant and are increasingly used (for example, in the analysis of EEG [10]).
One example of such a transformation for PPG are shown in figures 3 and 4. Figure 3 shows encountered in the process of load differences of the curves a two-fold Fourier transform of the cycle of PPG. Noticeable large diagnostic capabilities in comparison than the direct PPG signal or its spectrum.
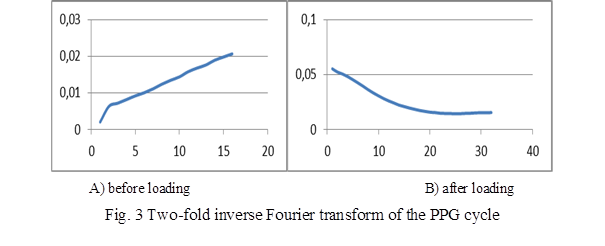
Figure 4 shows the function inverse Fourier transforms for the signals.
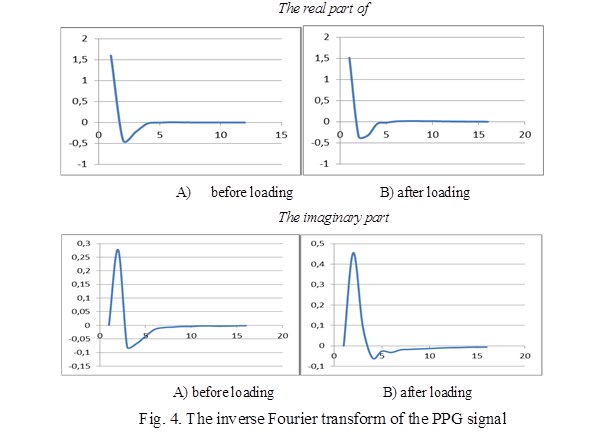
The function obtained in the process of inverse Fourier transform, have been suggested as a model of an analogue signal, exciting a certain system, leading to the filling of the vessels recorded by the cycle of PPG. Indeed, the filling of the vessels is a volume characteristic which is determined by the integration of some initial signal, then the inverse Fourier transform will be some model of the initiating signal. The behavior of the imaginary and real parts of the inverse transform are reminiscent of part of the heart rate of the ECG signal and therefore hypothetically can be used for analyzing cardiac activity without direct registration of the ECG signal.
The number of samples in one cycle of the PPG does not allow quite acceptable (adequately) apply a computational procedure classical spectral analysis. Meanwhile, the self-organizing approach to structural and parametric modeling allows you to apply a small sample volume to get an acceptable simulation of the solution [4, 7].
This approach includes, for example, the method of group accounting of arguments (GMDH) proposed by Ivakhnenko A. G. [2, 4, 6, 7] and allows to synthesize adequate harmonic pattern with non-multiple frequencies (formula (1)) and polynomial structures, with a variety of reference (in the simplest case – linear functions (formula (2)).
![]() , (1)
, (1)
![]() , (2)
, (2)
where: ![]() - model parameters (coefficients at the Terme); Lw and Lp is the number of terms, respectively, in the harmonic and polynomial models;
- model parameters (coefficients at the Terme); Lw and Lp is the number of terms, respectively, in the harmonic and polynomial models; ![]() and
and ![]() frequency and phase of the l-th harmonic;
frequency and phase of the l-th harmonic;![]() – support function in the l-th degree.
– support function in the l-th degree.
If analysis of the PPG with the structural-parametrical models (1) and (2) the following results are obtained:
- to load:
![]() , (4)
, (4)
![]() (5)
(5)
![]()
- after load:
![]() , (6)
, (6)
![]() (7)
(7)
![]() ,
,
The spectrum of the direct Fourier transform of a cycle of the photoplethysmography:
- to load:
![]()
![]() , (8)
, (8)
- after load:
![]()
![]() ; (9)
; (9)
Single inverse Fourier transform of a cycle of the photoplethysmography:
- to load:
![]()
![]() , (10)
, (10)
- after load:
![]()
![]() , (11)
, (11)
where: t is the time (in 0.01 sec; f=k * f0 - frequency spectrum (Hz) f0=1,56 Hz; T - period of the spectrum (sec); s(f) - module of the Fourier spectrum, si(f) - module of inverse Fourier transform.
The results suggest the existence of certain (possibly customized) frequency of filling of the peripheral vessels of the upper extremities (capillary) blood with periods of the order of 0.07 and 0.035 seconds, acceptable for sustained medium physical exercise, and frequency, which increases approximately 50% (respectively, the periods of 0.37 and 0.24 seconds). The latter is close to the work of pacemaker Purkinje fibers. "Base frequency" is characterized by the individual cardiovascular system for the person and remind frequency "yaw" search autonomous control system.
The coefficients of determination of models obtained allow us to conclude about the prospects of the proposed approach for the analysis and simulation function cycle of the photoplethysmogram. The simplest example of simulation based on the study of behavior of the first and second derivatives obtained by numerical differentiation, is shown in figure 5.
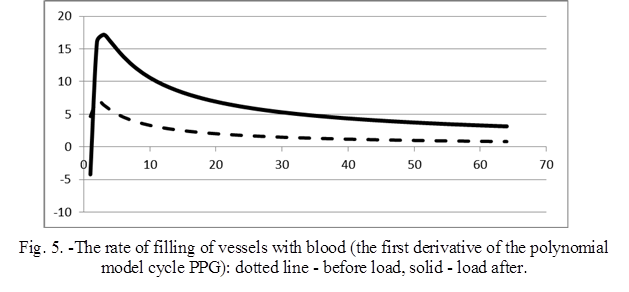
Clearly, that physical activity leads to an increase of blood flow velocity by some constant (in this case, almost two times) within a few tens of milliseconds with a further decrease logarithmically (y = -3,18ln(x) + 15,98 / R² = 0,98 to load and y = -1,1ln(x) + 5,2 /R² = 0,98 after load), striving for growth rate without load (a coincidence according to the above formulas will happen in a 1.65 seconds – approximately 2-3 cardiac cycle).
Conclusion: application of self-organization modeling, along with direct and inverse Fourier transforms of different multiplicity is a new and promising direction for the study of biological signal (photoplethysmogram) for the construction of diagnostic decision rules of individual character.
2. Artemenko M. V., Boytsova E. A., Lukashov M. I., Ustinov A. G. Synthesis of decision rules for automated classification of variants genteelly herpes on the basis of self-organization modelling // proceedings of southwest state University. Series: Management, computer engineering, Informatics, medical instrumentation, 2014, № 3. pp. 53-62
3. Digital processing of signal and image processing in radio physical applications. / Ed. by V. F. Kravchenko,- M.:FIZMATLIT, 2007. -544 C.
4. GMDH [Electronic resource]. - Mode of access: http://gmdh.net/, (accessed 16.03.2016) - title of screen.
5. Laboratory diagnostic device. Useful model RF 135899, the owner of the model Stavitsky R. V. (RU) /Urll: http://poleznayamodel.ru/model/13/135899.html
6. Lukashov M. I., Ustinov A. G., Artemenko M. V., Pismennaya E. V. Using the method of group account of arguments for the assessment of patients with genital herpes. //High technologies, 2014, V. 15. № 12, pp. 51-58.
7. Orlov A. A. The principles of the architecture of a software platform for implementing the algorithms of the group method of accounting arguments// Control systems and machines, 2013, №2, -pp. 65-71
8. Stavitsky R. V. The Blood - an indicator of the condition of the body and its systems, MNPI, 1999.-160 p.
9. Sudakov K. V. Physiology. Fundamentals and functional systems lectures. - M.: Medicine, 2000. - 772 p.
10. Tong S., Thankor, N. V. (ed.) Quantitative EEG Analysis Methods and Clinical Applications, Norwood, ARTECH HOUSE, 2009.- 440p.
Artemenko M.V., Pisarev M.V. SYNTHESIS AND STUDY OF MATHEMATICAL MODELS OF BIOMEDICAL SIGNALS METHODS OF SELF-ORGANIZATION MODELLING BY THE EXAMPLE OF THE PHOTOPLETHYSMOGRAM. International Journal Of Applied And Fundamental Research. – 2016. – № 5 –
URL: www.science-sd.com/467-25063 (23.07.2026).