


About Us
Executive Editor:Publishing house "Academy of Natural History"
Editorial Board:
Asgarov S. (Azerbaijan), Alakbarov M. (Azerbaijan), Aliev Z. (Azerbaijan), Babayev N. (Uzbekistan), Chiladze G. (Georgia), Datskovsky I. (Israel), Garbuz I. (Moldova), Gleizer S. (Germany), Ershina A. (Kazakhstan), Kobzev D. (Switzerland), Kohl O. (Germany), Ktshanyan M. (Armenia), Lande D. (Ukraine), Ledvanov M. (Russia), Makats V. (Ukraine), Miletic L. (Serbia), Moskovkin V. (Ukraine), Murzagaliyeva A. (Kazakhstan), Novikov A. (Ukraine), Rahimov R. (Uzbekistan), Romanchuk A. (Ukraine), Shamshiev B. (Kyrgyzstan), Usheva M. (Bulgaria), Vasileva M. (Bulgar).


Phisics and Mathematics
 PDF
PDFAs is known [1-2], the process of fatigue destruction of metals and alloys occurs by the gradual development and accumulation of damages, first submicroscopic, then microscopic, followed by a transition to macroscopic discontinuities - the formation of fatigue cracks.
The influence of the cyclic loading conditions is taken into account by the stress level under various stress conditions (bending with rotation, tension-compression, torsion, etc.), loading frequency [3-5] and temperature.
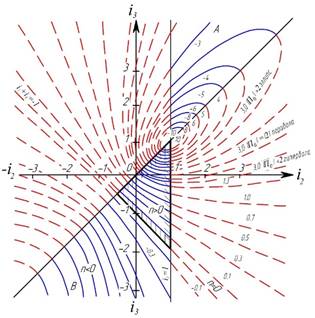
Theoretically, the possible values of the stress state index П are obtained from the analysis of the expression  under the condition that σ1 > σ2 > σ3 ≠ 0. They are shown in Fig. 1, a, in the coordinate system П=φ (i1, i2, i3), где i1 = σ1 / σ1 = 1.0; i2 = σ2 / σ1; i3 = σ1 / σ1 (Figure 2, b). The graphs of a line of the same concentration П (Fig. 2a) for П > 2 will be an ellipse, for П = 2 – a parabola and for П < 2 – a hyperbola. The scope of the function is found from the inequalities 1 ≥ i2 ≥ i3 и 1 ≤ i2≤ i3. The region defined by the first inequality (Fig. 2, a) is denoted by the letter A, the second inequality by B. The function Π will be positive in the region B only in the triangle designated by the hatching, bounded by straight lines: i3 = i2; i2 = 1,0 и i2 + i3 = 1,0. In all other cases of the region B, and also in the whole region A, the quantity Π is negative.
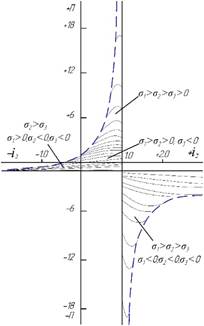
Values of П in the interval from - 18 до + 18, covering practical areas of stress states of mechanical tests are shown in Fig. 2, b (for σ1 > σ2 > σ3 ≠ 0). They can be attributed to any stage of the behavior of a deformable solid, including the elastic, plastic regions and the moment of its destruction.
If we consider the essence of cyclic loading and fracture, in fact it reduces to a competition between the loading rates (εн) and the relaxation rate of internal stresses ( рел=р) [6], consisting in the accumulation of damages and actually being the rate of fall of the fracture resistance (σк) of the material i.e. р To assess the ultimate deformation of metal alloys and the resistance to cyclic deformation of polycrystals depending on the factors of their state: the ratio of the density in the initial and final states, the structural-energy state (the consistency of hardness and the yield point), the stress-strain state and the ratio of internal stress relaxation rates and loading rates, the following equations are proposed:
 (1);
(1);
 (2),
(2),
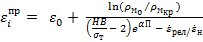
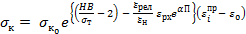
where  – is the elastic deformation;
  – the initial density of the metal; HB – hardness of the material (alloy) in a given thermomechanical state; σт – is the yield point (elasticity) of the material base at which shear under cyclic loading is possible; П – is the stress state index, varying from - ∞ (under compression) to + ∞ (under tension); α – is a coefficient that takes into account the influence of the Lode coefficients-the type of strains and stresses.
 a)
a)
 b)
b)
Fig. 1. The theoretical value of the stress state index Π, calculated from the expression П = ± (σ1 + σ2 + σ3) / σi: a - depending on the dimensionless quantities i1 = σ1 / σ1 = 1.0; i2 = σ2 / σ1; i3 = σ1 / σ1 (real ranges of П are denoted by solid lines); b - the same, but in another coordinate system, in the range of values of П from -18 to +18
2. Mylnikov V.V., Romanov A.D., Shetulov D.I., Khlybov A.A. Effect of the aging temperature of steel on the parameters of fatigue resistance and microstrain // Metal Science and Heat Treatment. 2016. – р. 1-3.
3. Mylnikov V.V., Shetulov D.I., Chernyshov E.A. Variation in faktors of fatigue resistance for som pure metals as a function of the freguensy of loading sycles // Russ. J. Non-Ferr. Met. – 2010. Vol. 51, No. 3. – р.237–242.
4. Mylnikov V.V., Shetulov D.I., Chernyshov E.A. Investigation into the Surface Damage of Pure Metals Allowing for the Cyclic Loading Frequency // Russ. J. Non-Ferr. Met. – 2013. Vol. 54, No. 3. – р.229–233.
5. Mylnikov V.V., Shetulov D.I., Chernyshov E.A. Speed Effect upon Varying the Cyclic Loading Frequency for Certain Pure Metals // Russ. J. Non-Ferr. Met. 2015. Vol. 56. No. 6. pp. 627–632.
6. Skudnov V.A. Limiting plastic deformation of metals. - Moscow: Metallurgy, 1989. - 176 p.
Mylnikov V.V., Skudnov V.A. ACCOUNT OF LOAD CONDITIONS FOR ESTIMATION OF LIMIT CHARACTERISTICS OF CYCLIC DESTROYING. International Journal Of Applied And Fundamental Research. – 2017. – № 3 –
URL: www.science-sd.com/471-25292 (13.06.2026).